


Stocks fell last week as investors assessed the implications of a fresh Middle East conflict while digesting mixed reports on the jobs market. The Standard & Poor’s 500 Index fell 2.02%, the S&P 500 ended Friday's session at 6,740.02 while the Nasdaq Composite Index slid 1.24% ending Friday's session at 22,387.68. The Dow Jones Industrial Average declined 3.05% ending Friday's session at 47,501.55. The MSCI EAFE Index, which tracks developed overseas stock markets, lost 6.62%.1,2 Middle East ConflictUS stocks were in the red for much of the week as investors digested the start of the US-Israel war with Iran. The war, now in its seventh day, has led to a wider conflict in the Middle East. Crude prices jumped above $90 a barrel as the Strait of Hormuz, the world's most important chokepoint for crude flows, remains effectively shut. However, the decline was short-lived as investors “bought the dip.” All three major averages recovered or nearly recovered from their intraday lows by Monday’s close.3 We'll be watching for de-escalation in the Middle East Conflict as well as stimulus levers being pulled in the coming weeks and months to regain price stability in oil. As our base-case, we also believe that the current oil shock will not lead to recession in the U.S. The weekly drop was broad, affecting every sector except energy. The materials sector had the largest percentage loss, sliding 7.2%, followed by a 4.9% decline in consumer staples, a 4.6% drop in health care, and a 4.1% slip in industrials. Real estate, utilities, and communication services shed more than 2% each, while financials, consumer discretionary, and technology also edged lower. PPG Industries (PPG) and Freeport-McMoRan (FCX) had the largest weekly percentage losses in the materials sector, falling 13% each. Also weighing on materials, Vulcan Materials (VMC) shares slid 11%. JPMorgan downgraded its investment rating on the stock to neutral from overweight and cut its price target on the shares to $320 each from $335. In consumer staples, Brown-Forman (BF.B) was among the hardest-hit stocks, falling 12%. The wine and spirits maker reported higher-than-expected fiscal third-quarter results but reiterated its full-year outlook for organic sales to decline. The company is facing headwinds from structural declines in alcohol consumption, an oversupply of American whiskey, rising competition, and increasing costs, Morgan Stanley said in a note to clients. Energy, the lone sector in positive territory for the week, rose 1% amid surging crude prices. Marathon Petroleum (MPC) and Valero Energy (VLO) had the biggest weekly percentage gains, rising 11.6% and 9.8%, respectively. |
 |
Source: YCharts.com, March 7, 2026. Weekly performance is measured from Monday, March 2 to Friday, March 6. TR = total return for the index, which includes any dividends as well as anyother cash distributions during the period. Treasury note yield is expressed in basis points. |
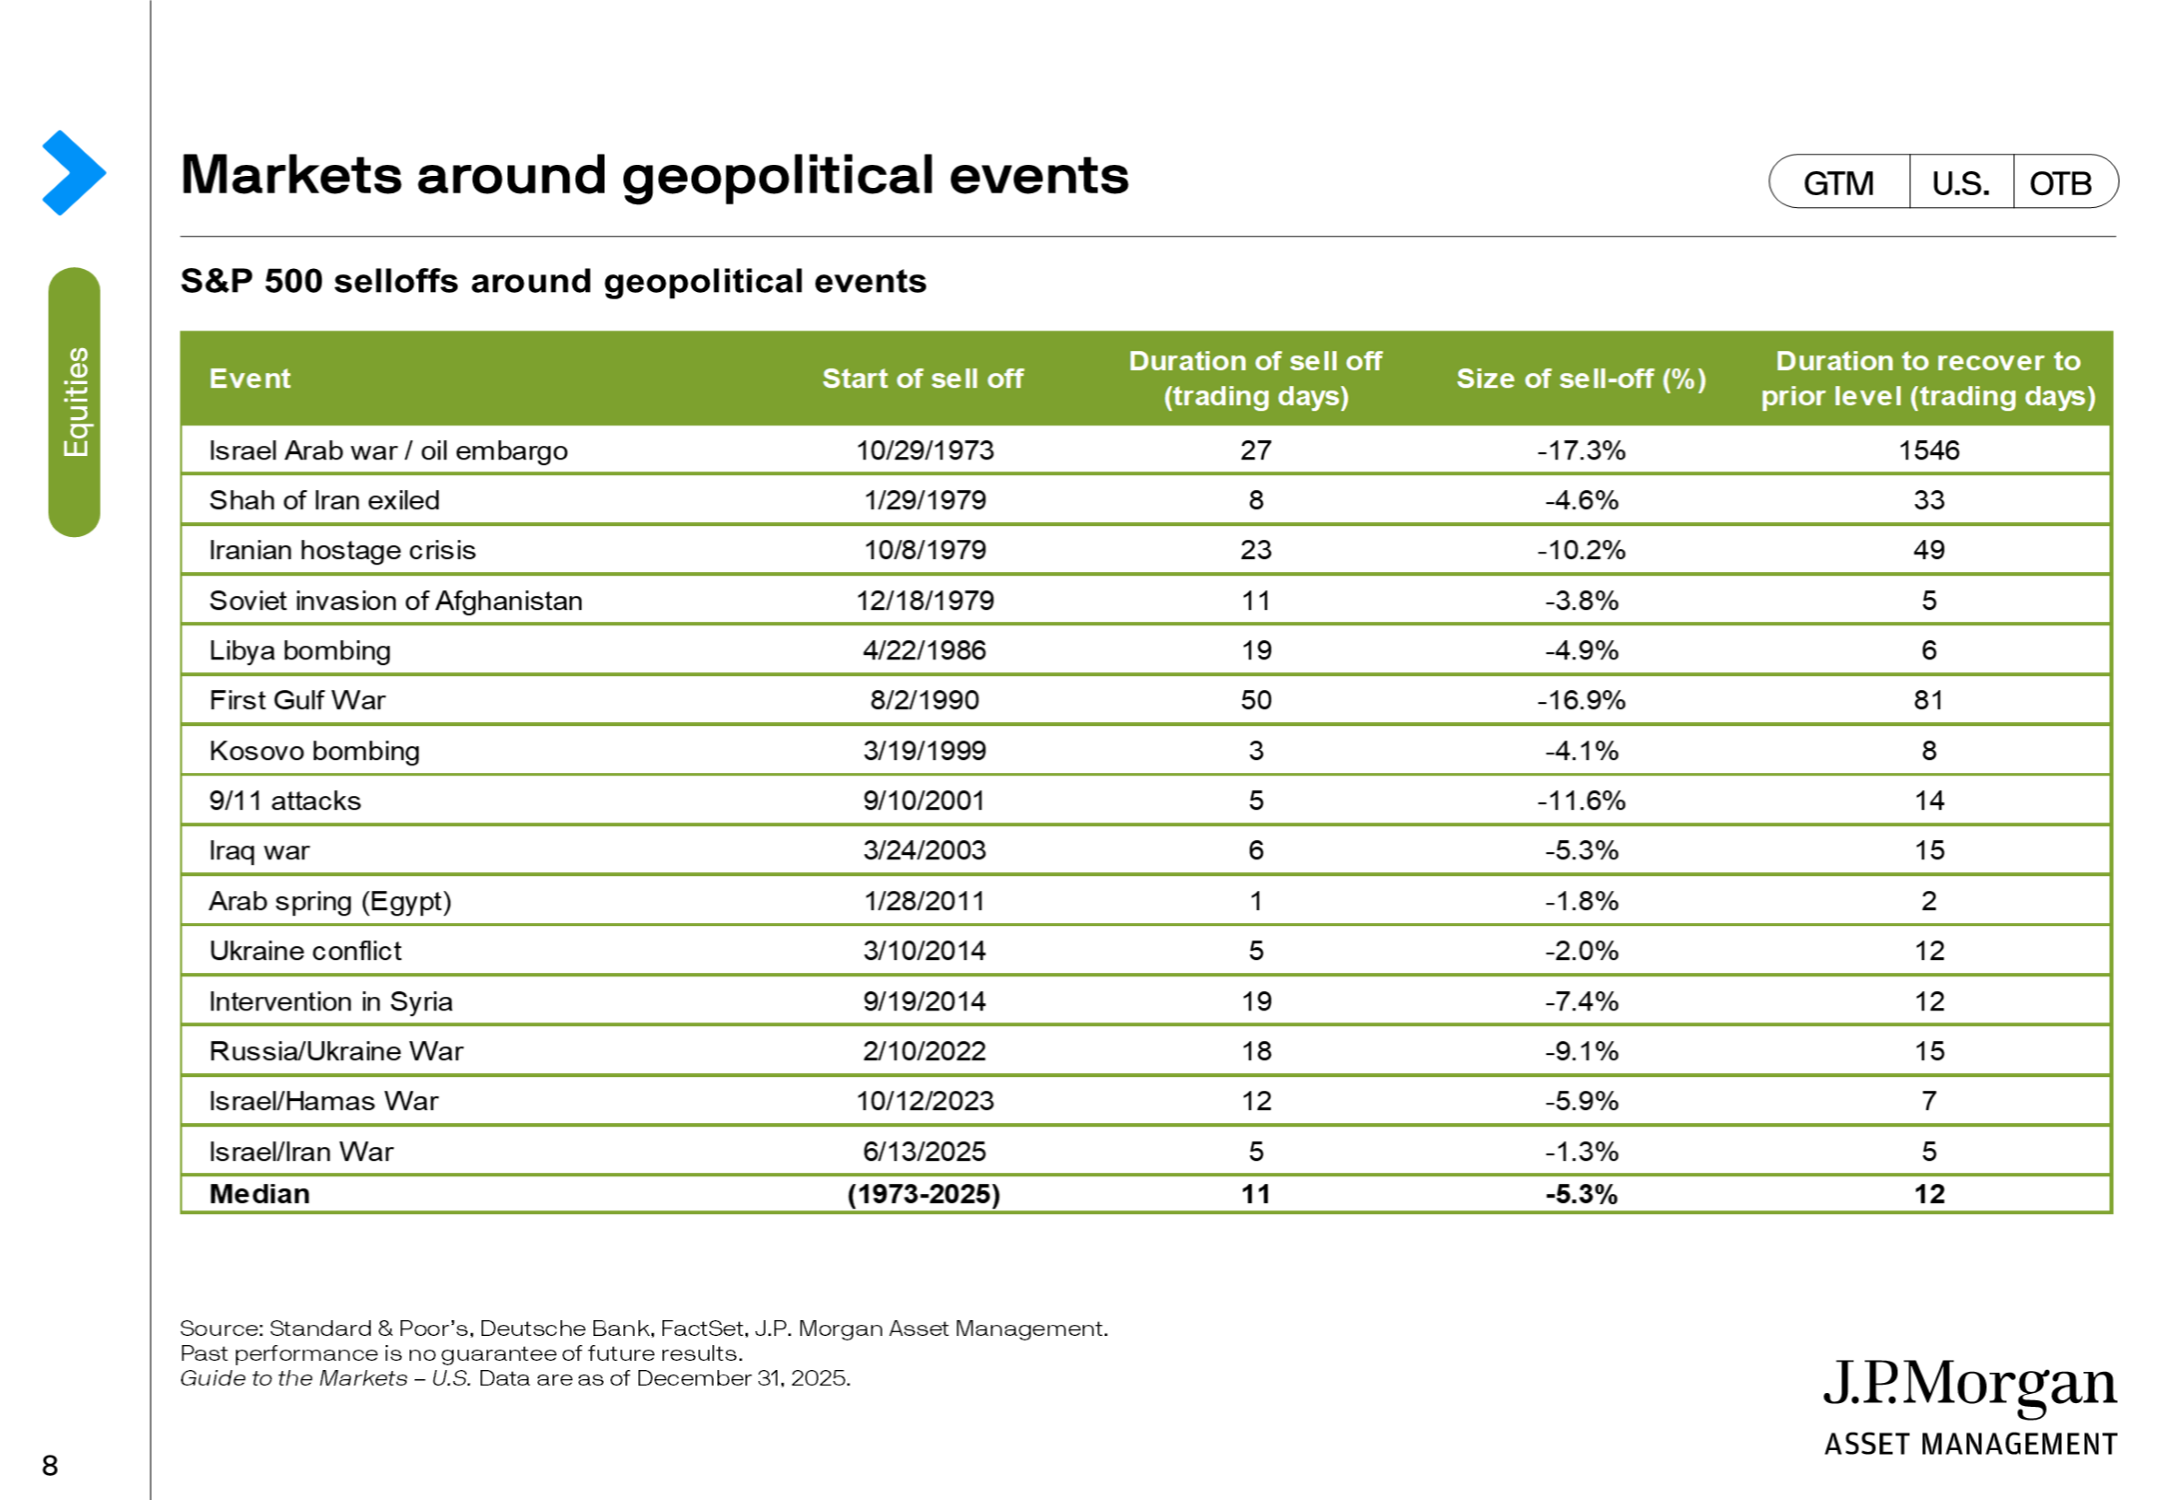
Focus On OilAs of Monday, March 3, 2026 U.S. crude oil prices rose to around $116.77/barrel (intra-day high) —the biggest weekly gain since 1983. The conflict has brought tanker traffic in the Strait of Hormuz, a key shipping route for energy supplies, to a near standstill. Also, an ongoing concern is how insurance companies will adjust rates in the coming weeks due to heightened risks.8 Chart(s) of the WeekMarkets around geopolitical events: Notice the duration to recover is quite quick historically speaking
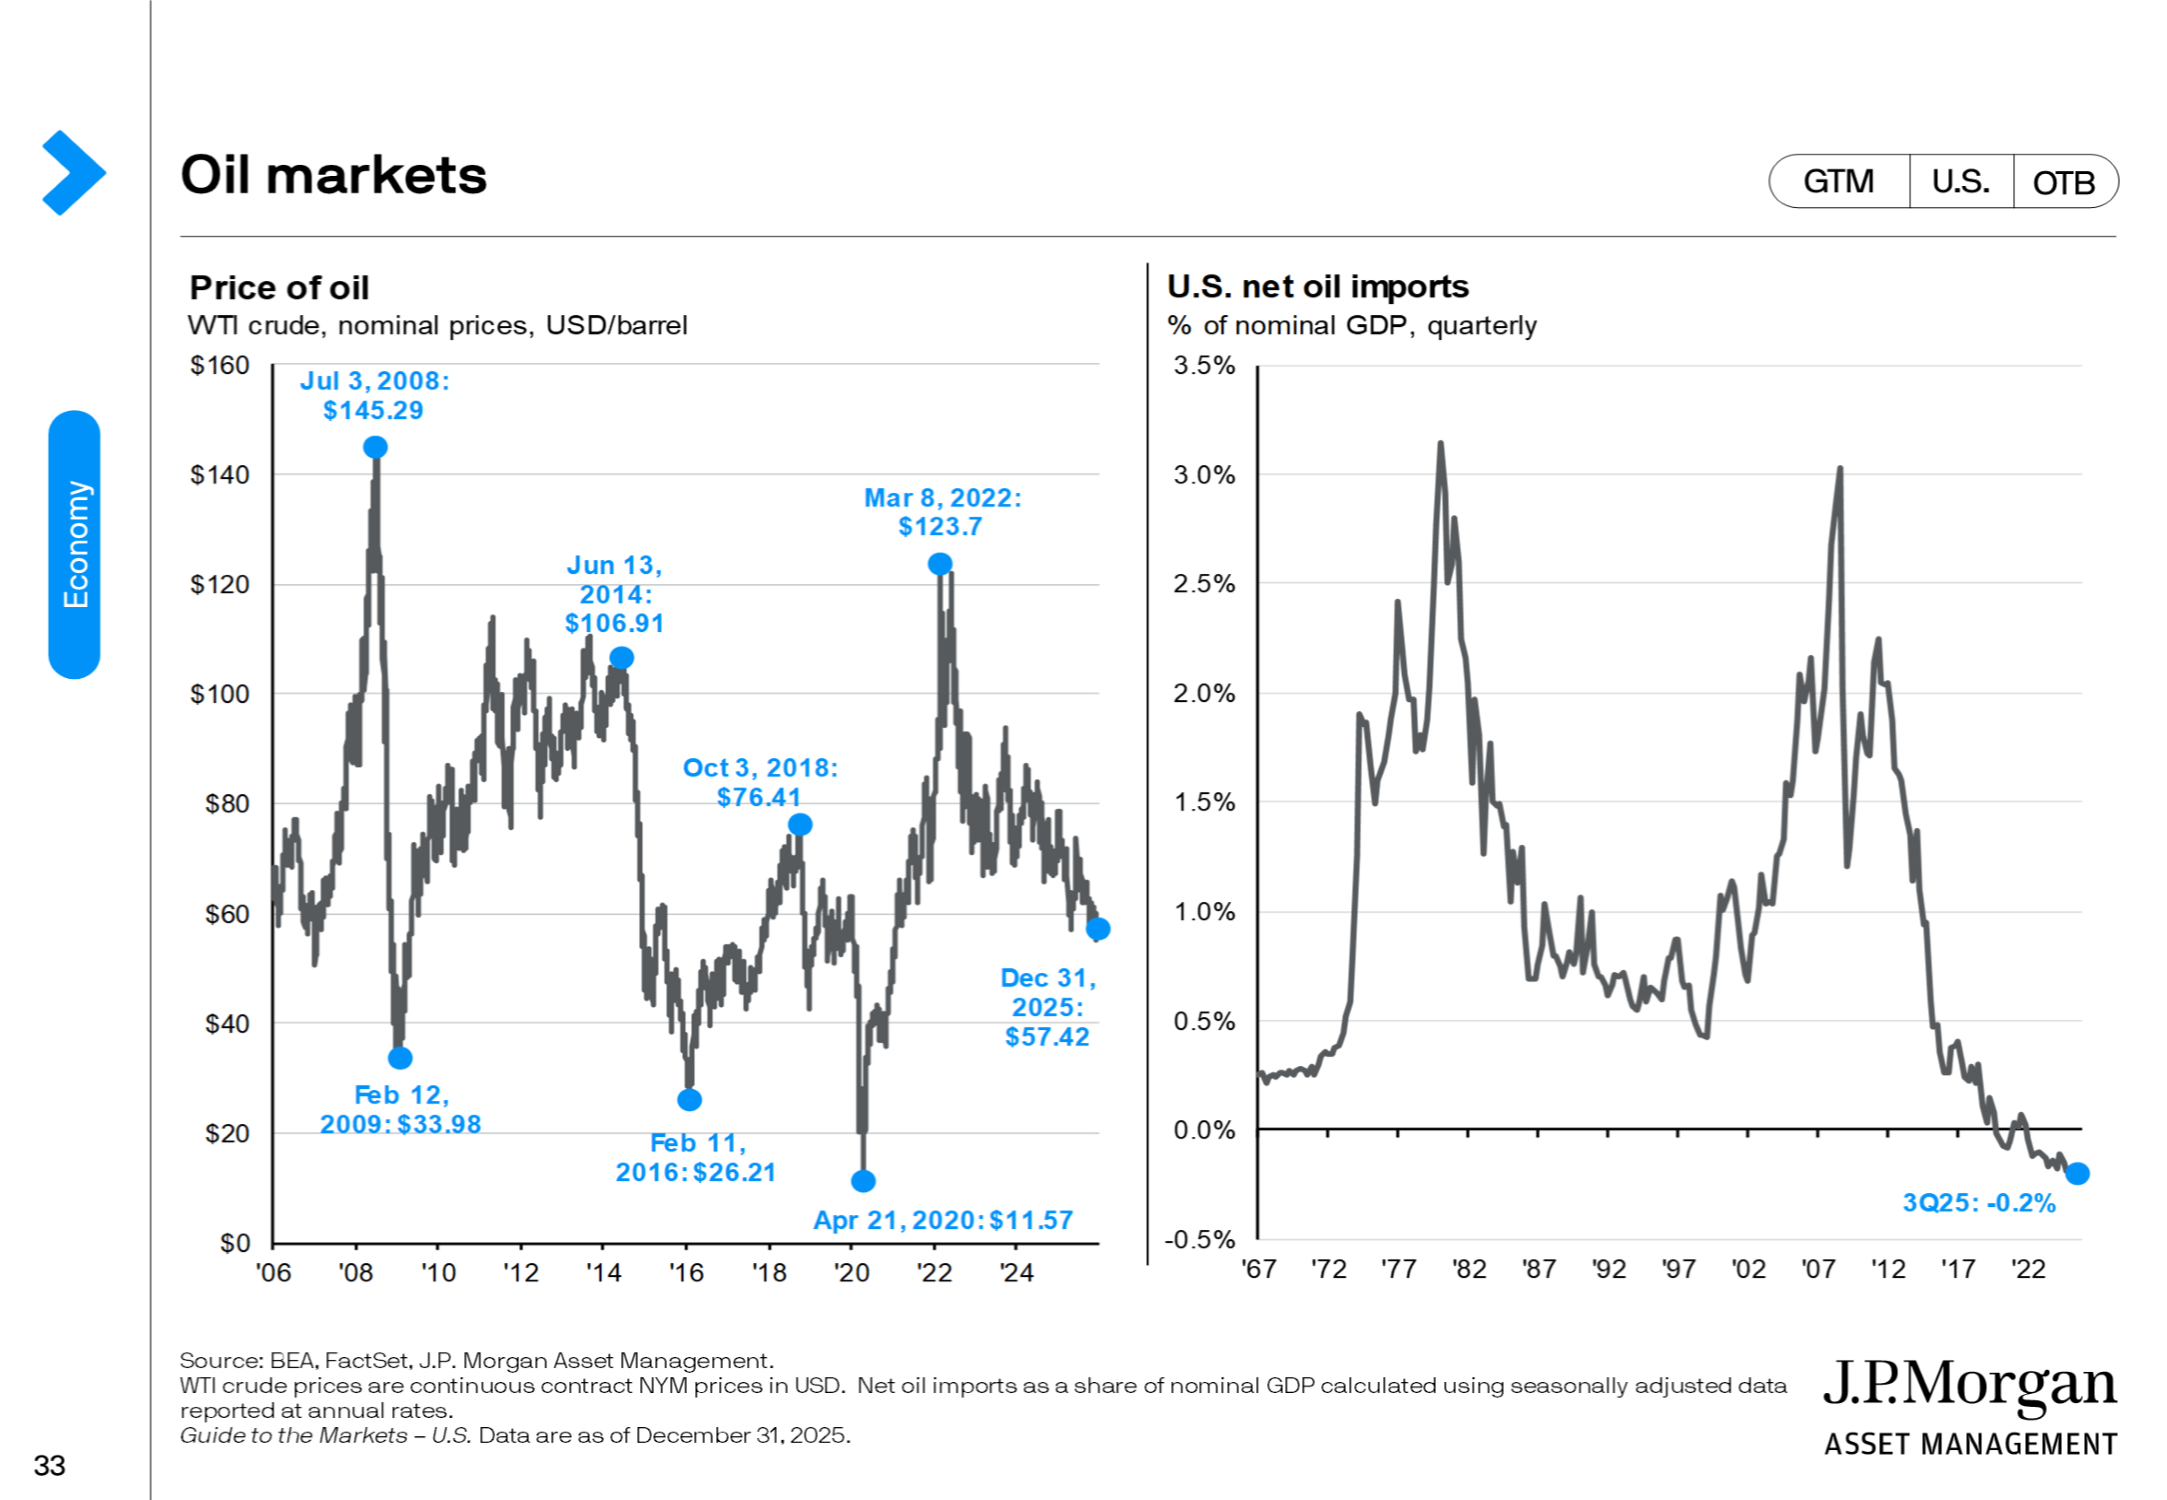
Source: Standard & Poor’s, Deutsche Bank, FactSet, J.P. Morgan Asset Management. Past performance is no guarantee of future results. "Oil Markets": U.S. is a net exporter
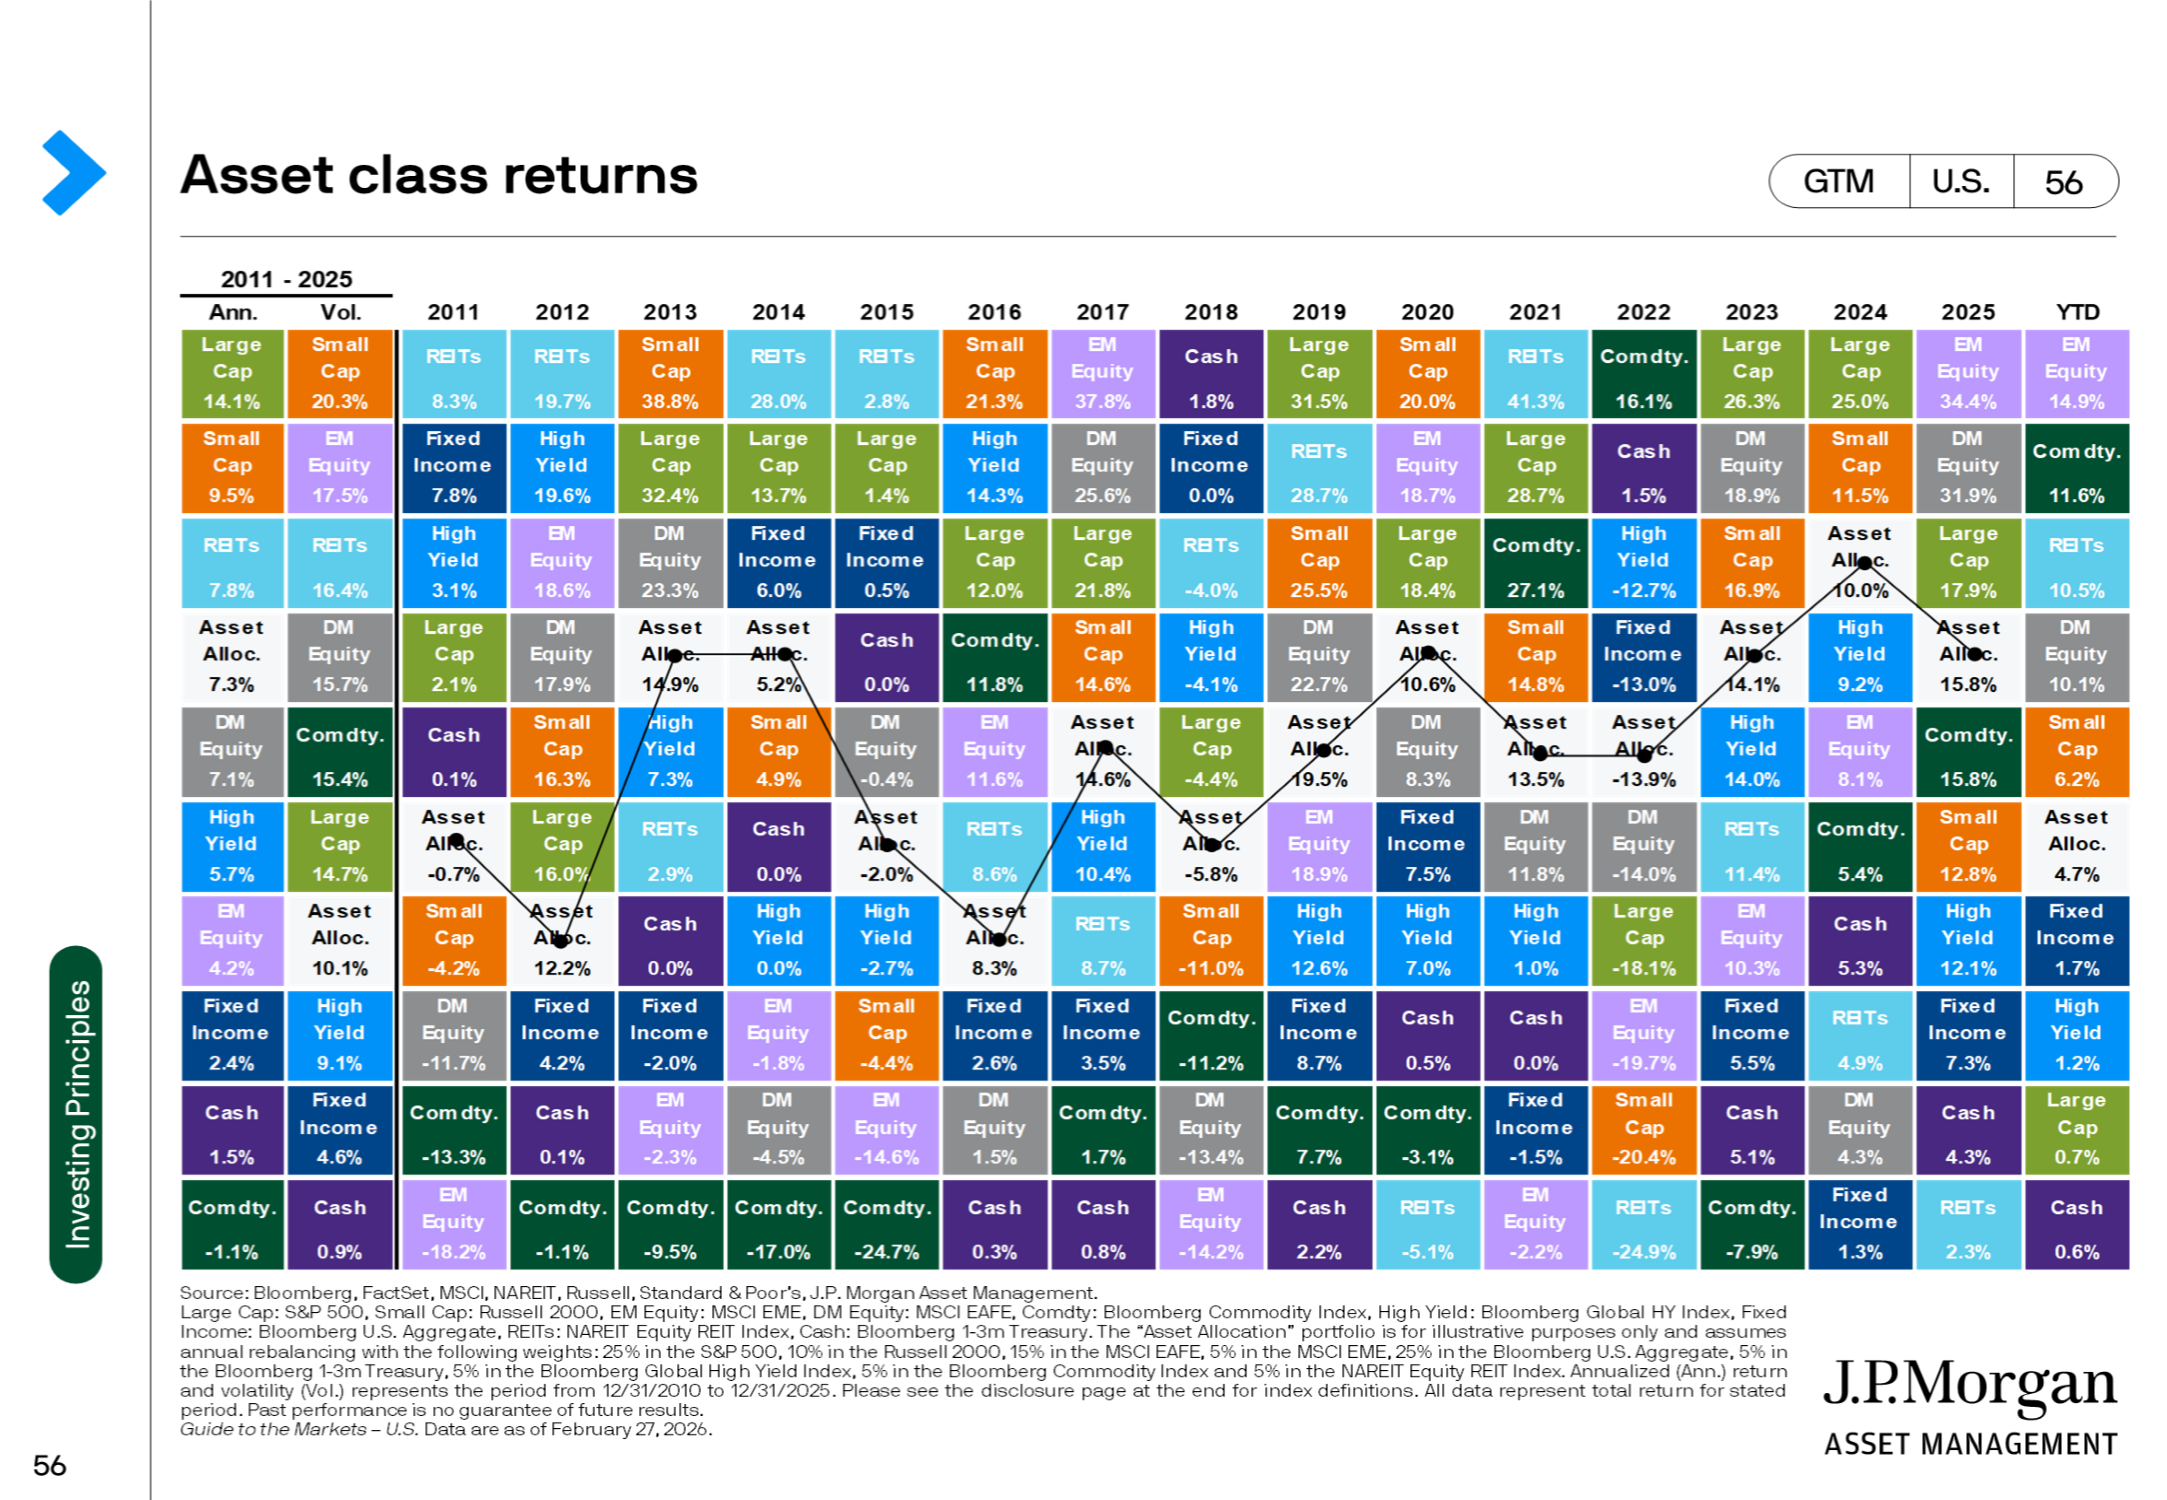
Source: BEA, FactSet, J.P. Morgan Asset Management. WTI crude prices are continuous contract NYM prices in USD. Net oil imports as a share of nominal GDP calculated using seasonally adjusted data reported at annual rates. Asset Class Returns: U.S. Market (2011-2025)Diversification among different asset classes is important in portfolio construction
Source: Bloomberg, FactSet, MSCI, NAREIT, Russell, Standard & Poor’s, J.P. Morgan Asset Management. Large Cap: S&P 500, Small Cap: Russell 2000, EM Equity: MSCI EME, DM Equity: MSCI EAFE, Comdty: Bloomberg Commodity Index, High Yield: Bloomberg Global HY Index, Fixed Income: Bloomberg U.S. Aggregate, REITs: NAREIT Equity REIT Index, Cash: Bloomberg 1-3m Treasury. The “Asset Allocation” portfolio is for illustrative purposes only and assumes annual rebalancing with the following weights: 25% in the S&P 500, 10% in the Russell 2000, 15% in the MSCI EAFE, 5% in the MSCI EME, 25% in the Bloomberg U.S. Aggregate, 5% in the Bloomberg 1-3m Treasury, 5% in the Bloomberg Global High Yield Index, 5% in the Bloomberg Commodity Index and 5% in the NAREIT Equity REIT Index. Annualized (Ann.) return and volatility (Vol.) represents the period from 12/31/2010 to 12/31/2025. Please see the disclosure page at the end for index definitions. All data represent total return for stated period. Past performance is no guarantee of future results. This Week: Key Economic DataTuesday: NFIB Small Business Optimism Index. Existing Home Sales. Wednesday: Consumer Price Index (CPI). Federal Budget. Thursday: Weekly Jobless Claims. Trade Deficit. Housing Starts. Building Permits. Friday: Gross Domestic Product (Q4—first revision). Personal Consumption & Expenditures Index* (Jan). Durable Goods* (Jan). Job Openings* (Jan). Consumer Sentiment. *Indicates federal data release delayed by the government shutdown in October and November of last year Source: Investors Business Daily - Econoday economic calendar: March 6, 2026. This Week: Companies Reporting EarningsTuesday: Oracle Corporation (ORCL) Thursday: Adobe Inc. (ADBE), Wheaton Precious Metals Corp. (WPM) Source: Zacks, March 6, 2026. Companies mentioned are for informational purposes only. It should not be considered a solicitation for the purchase or sale of the securities. Investing involves risks, and investment decisions should be based on your goals, time horizon, and risk tolerance. The return and principal value of investments will fluctuate as market conditions change. When sold, investments may be worth more or less than their original cost. Companies may reschedule their earnings reports without notice. |
 |
"Kindness eases change. Love quiets fear." - Octavia E. Butler |
 |
3 Facts About Capital GainsWhen you sell a capital asset, like an investment or a piece of property, the sale can result in a capital gain or loss. The Internal Revenue Service (IRS) defines a capital asset as “almost anything you own for personal use or own as an investment.” Here are three facts you should keep in mind: Tip adapted from IRS.gov9 |
 |
Finding Inner Peace Inside (And Indoors)Practiced for thousands of years, yoga has been revived in the last couple of decades. Yoga can be an optimal exercise choice for many individuals of all ages. But before starting any fitness regimen, discuss any medical concerns with your healthcare provider; this information is not a substitute for medical advice. While there are many different styles of yoga, it is generally a low-impact form of exercise. But in addition to the fitness benefits, it can help you learn relaxation and breathing techniques, regulate emotions, and quiet your mind. It’s also a great form of indoor exercise, and there are thousands of free classes online. So, if you’re looking for a way to promote both physical and mental health, you can practice quieting your inner monologue and start doing yoga from the comfort of your home. Tip adapted from Yogabasics.com10 |
 |
It can be measured despite lacking length, width, or height. What is it? All about but unseen, can be captured but can’t be held, has no throat but can be heard. What is it? Answer: The wind. |
 |
 |
Great Indian Rhinoceros (Rhinoceros unicornis) Kaziranga National Park, Assam, India |
Footnotes And Sources1. WSJ.com, March 6, 2026 11. MT Newswires, YCharts.com, March 2-6, 2026 |
Investing involves risks, and investment decisions should be based on your own goals, time horizon, and tolerance for risk. The return and principal value of investments will fluctuate as market conditions change. When sold, investments may be worth more or less than their original cost.
The forecasts or forward-looking statements are based on assumptions, may not materialize, and are subject to revision without notice.
The market indexes discussed are unmanaged, and generally, considered representative of their respective markets. Index performance is not indicative of the past performance of a particular investment. Indexes do not incur management fees, costs, and expenses. Individuals cannot directly invest in unmanaged indexes. Past performance does not guarantee future results.
The Dow Jones Industrial Average is an unmanaged index that is generally considered representative of large-capitalization companies on the U.S. stock market. The Nasdaq Composite is an index of the common stocks and similar securities listed on the Nasdaq stock market and considered a broad indicator of the performance of stocks of technology and growth companies. The MSCI EAFE Index was created by Morgan Stanley Capital International (MSCI) and serves as a benchmark of the performance of major international equity markets, as represented by 21 major MSCI indexes from Europe, Australia, and Southeast Asia. The S&P 500 Composite Index is an unmanaged group of securities that are considered to be representative of the stock market in general.
U.S. Treasury Notes are guaranteed by the federal government as to the timely payment of principal and interest. However, if you sell a Treasury Note prior to maturity, it may be worth more or less than the original price paid. Fixed income investments are subject to various risks including changes in interest rates, credit quality, inflation risk, market valuations, prepayments, corporate events, tax ramifications and other factors.
International investments carry additional risks, which include differences in financial reporting standards, currency exchange rates, political risks unique to a specific country, foreign taxes and regulations, and the potential for illiquid markets. These factors may result in greater share price volatility.
Please consult your financial professional for additional information.
This content is developed from sources believed to be providing accurate information. The information in this material is not intended as tax or legal advice. Please consult legal or tax professionals for specific information regarding your individual situation. This material was developed and produced by FMG Suite to provide information on a topic that may be of interest. FMG is not affiliated with the named representative, financial professional, Registered Investment Advisor, Broker-Dealer, nor state- or SEC-registered investment advisory firm. The opinions expressed and material provided are for general information, and they should not be considered a solicitation for the purchase or sale of any security.
Copyright 2026 FMG Suite.